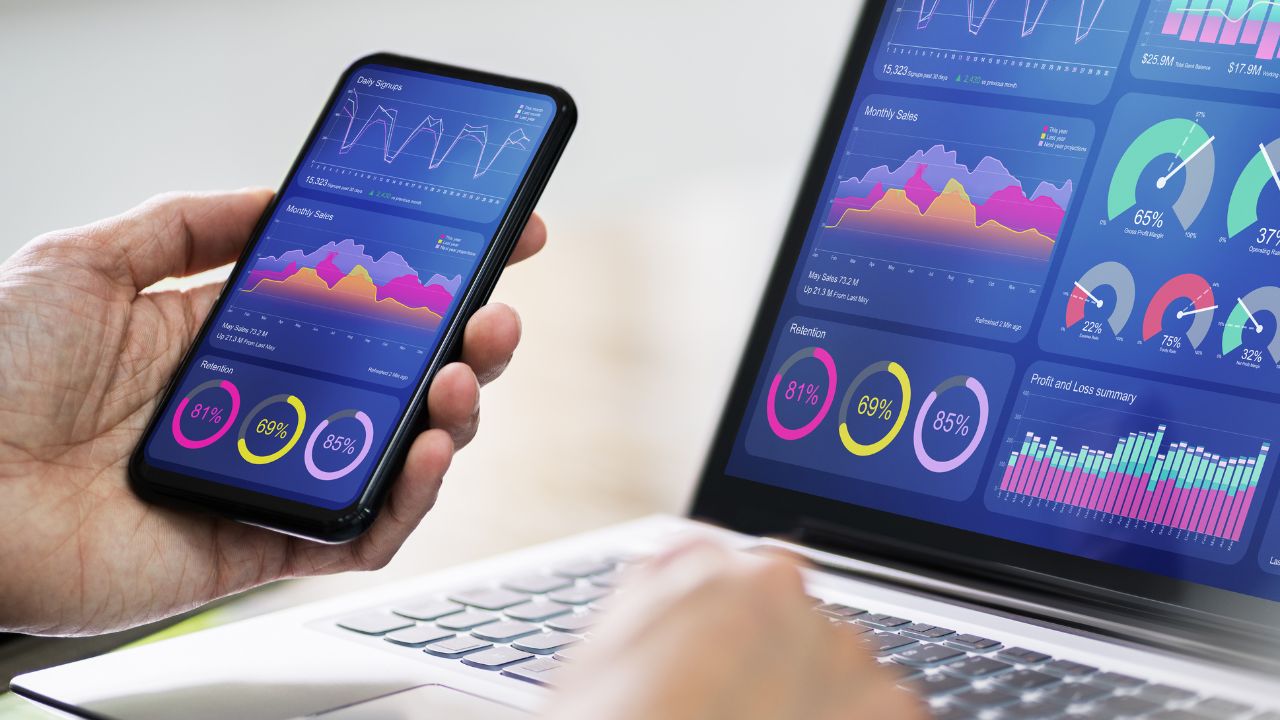
By Sandra Galiano - Business Analytics is fast becoming a fundamental tool for any entrepreneur wishing to be successful. This is because nowadays, we generate data practically every moment in every single second of every day without even noticing.
“There were 5 Exabytes of information created between the dawn of civilization through 2003 (...), but that much information is now created every two days, and the pace is increasing.” - Eric Schmidt, CEO at Google.
Taking into account the relevance of social media and our significant ‘daily life usage’ contribution to these technologies, we have - as a direct result - a hyperconnected world in which information appears to be power, now more than ever.
“Data analytics is the future, and the future is NOW! Every mouse click, keyboard button press, swipe or tap is used to shape business decisions. Everything is about data these days. Data is information, and information is power.”- Radi, Data Analyst at CENTOGENE.
In this world - thanks to current technologies - we can have a totally different lifestyle from the one our parents or even older siblings experienced.
Our communication, buying, selling, investing, planning trips, and even entrepreneurship undertaking - among many other facets of human activity - had changed due to the profound implications of the current data technologies.
So, it is only logical to imagine that, for specific jobs, the result will be to outgrow, transform, or even die. One of the areas impacted in this fashion is the one we aim to focus on in this article: Business Analyst.
Business Analytics is the discipline focused on analyzing data with the objective of providing the company with favorable results and increasing the decision-making process.
Thus, a Business Analyst is a person whose firm grasp of both worlds - technology and business - allows the contribution and proper team working between the CEO and the programmer since he can deeply understand the two parts involved.

What should we do? What's the next step? How can I solve this problem? These and many more questions can be answered with business analytics, having data as the centerpiece of the whole project.
The decision-making process is based on three main types of analytics encompassed in the business analytics area, those are:
In this analytics, we use techniques such as sentiment analysis, statistics, averages, graphic visualization, dashboards, etc.
Every Business Analytics project follows certain well-structured steps that include the tools to use and how to proceed. This is what data scientists or analysts use professionally in a company. However, all of this is scalable, it can be shaped for a small business or an entrepreneur from the most elemental, and still, without having the greatest techniques or tools, results can be improved considerably.

“Data are just summaries of thousands of stories—tell a few of those stories to help make the data meaningful.” - Dan Heath, bestselling author.
The data is there, everywhere. However, not all have the same quality. It is important, when using business techniques based on data analysis, to find reliable sources of information and, above all, useful ones.
There are many tools for this; I recommend doing two procedures when working with sources: go to secure pages of high-quality information and differentiate between data, information, knowledge, and insight.
“We are surrounded by data, but starved for insights.”- Jay Baer, marketing and customer experience expert.
It is very important to follow the steps of data, information, knowledge, and insight to discern what we have, where we come from, and where we are heading.
By interpreting the data and giving it meaning, we find the information, and when we draw conclusions from this, we have the knowledge, being able to obtain valuable insight.
What kind of data do we have? We could mainly divide them into 3
categories according to their format:
And what about sources? We can divide them into sources internal to the company and external.
Regarding the internal ones, we find CRM (customer relationship management) and ERP (enterprise resource planning). The first is associated with the management of the relationship with customers and commercial contracts, and the second one is with the company's own finances, sales, purchases, etc. In general, any data that the company itself gives us comes from an internal source.
In external sources to the company, we will therefore have all the data that we obtain from abroad but that we need or that is convenient for the company. Examples: social networks, open data from governments, and official sources such as the National Statistics Institute, among others.

1. Data extraction
2. Cleaning: Duplications, correct errors, complete empty values…
3. Transformation: recovers the clean data and summarizes it in the analysis models.
4. Integration: Validation that the data that we are going to load is consistent with the necessary definitions and formats.
5. Update: A process that allows us to add new data to the repository.
To make the long story short, data analysis can transform your business, not only making it more profitable, solving problems, or anticipating what the future holds, but also fulfilling the obligation to adapt to the constantly changing society that reigns in these times and avoiding being left behind, or stagnate; and as it is printed on the vinyl of my university class, “to transform a world of data into a world of intelligence”.

About the author: Sandra is a tech-savvy young entrepreneur currently President of Generación Empresarial, a youth-oriented university association committed to creating the next generation of successful European business leaders.



By continuing to use the site, you agree to the use of cookies. more information
The cookie settings on this website are set to "allow cookies" to give you the best browsing experience possible. If you continue to use this website without changing your cookie settings or you click "Accept" below then you are consenting to this.